Quantitative analysis of the extracted RNA with spectrophotometer

Quantitative analysis of the extracted RNA with spectrophotometer
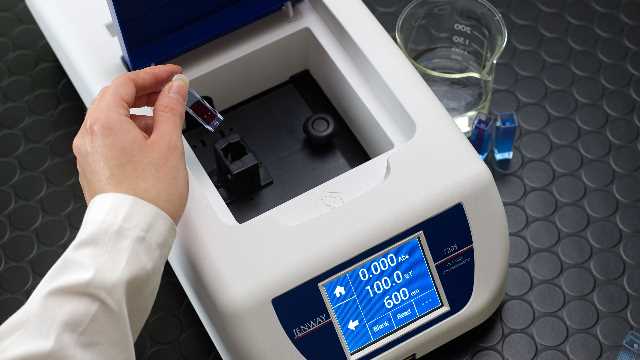
The concentration and purity of the extracted RNA can be assessed using by the nanodrop spectrophotometer. The optical absorbance of the samples is measured at 240-260 nm.
The OD A260/A280 ratio
The OD A260 / A280 ratio indicates the purity of the extracted RNA, which has a direct correlation with protein contamination. The OD A260 / A280 ratio is 2 indicating high purity.
The OD260 / OD230 ratio
RNA contamination assessment of the used materials can be applied for extraction. Its closeness to the number 2 makes the test more desirable. Low levels of OD260 / OD230 show the contamination of extracted RNA with salt, carbohydrate, peptide, and phenol. Mostly, the high-level of lysis buffers can reduce this amount. In the low-density specimen, this amount is further reduced.
Related posts: RNase inactivation during RNA extraction – Quantitative analysis of the extracted RNA cell or tissue with spectrophotometer